REACTION TIME VS REFLEX - how fast does your brain react to stimuli?
Explore reflexes vs. reactions and measure the speed of your nervous system—no soccer balls to the face… yet!
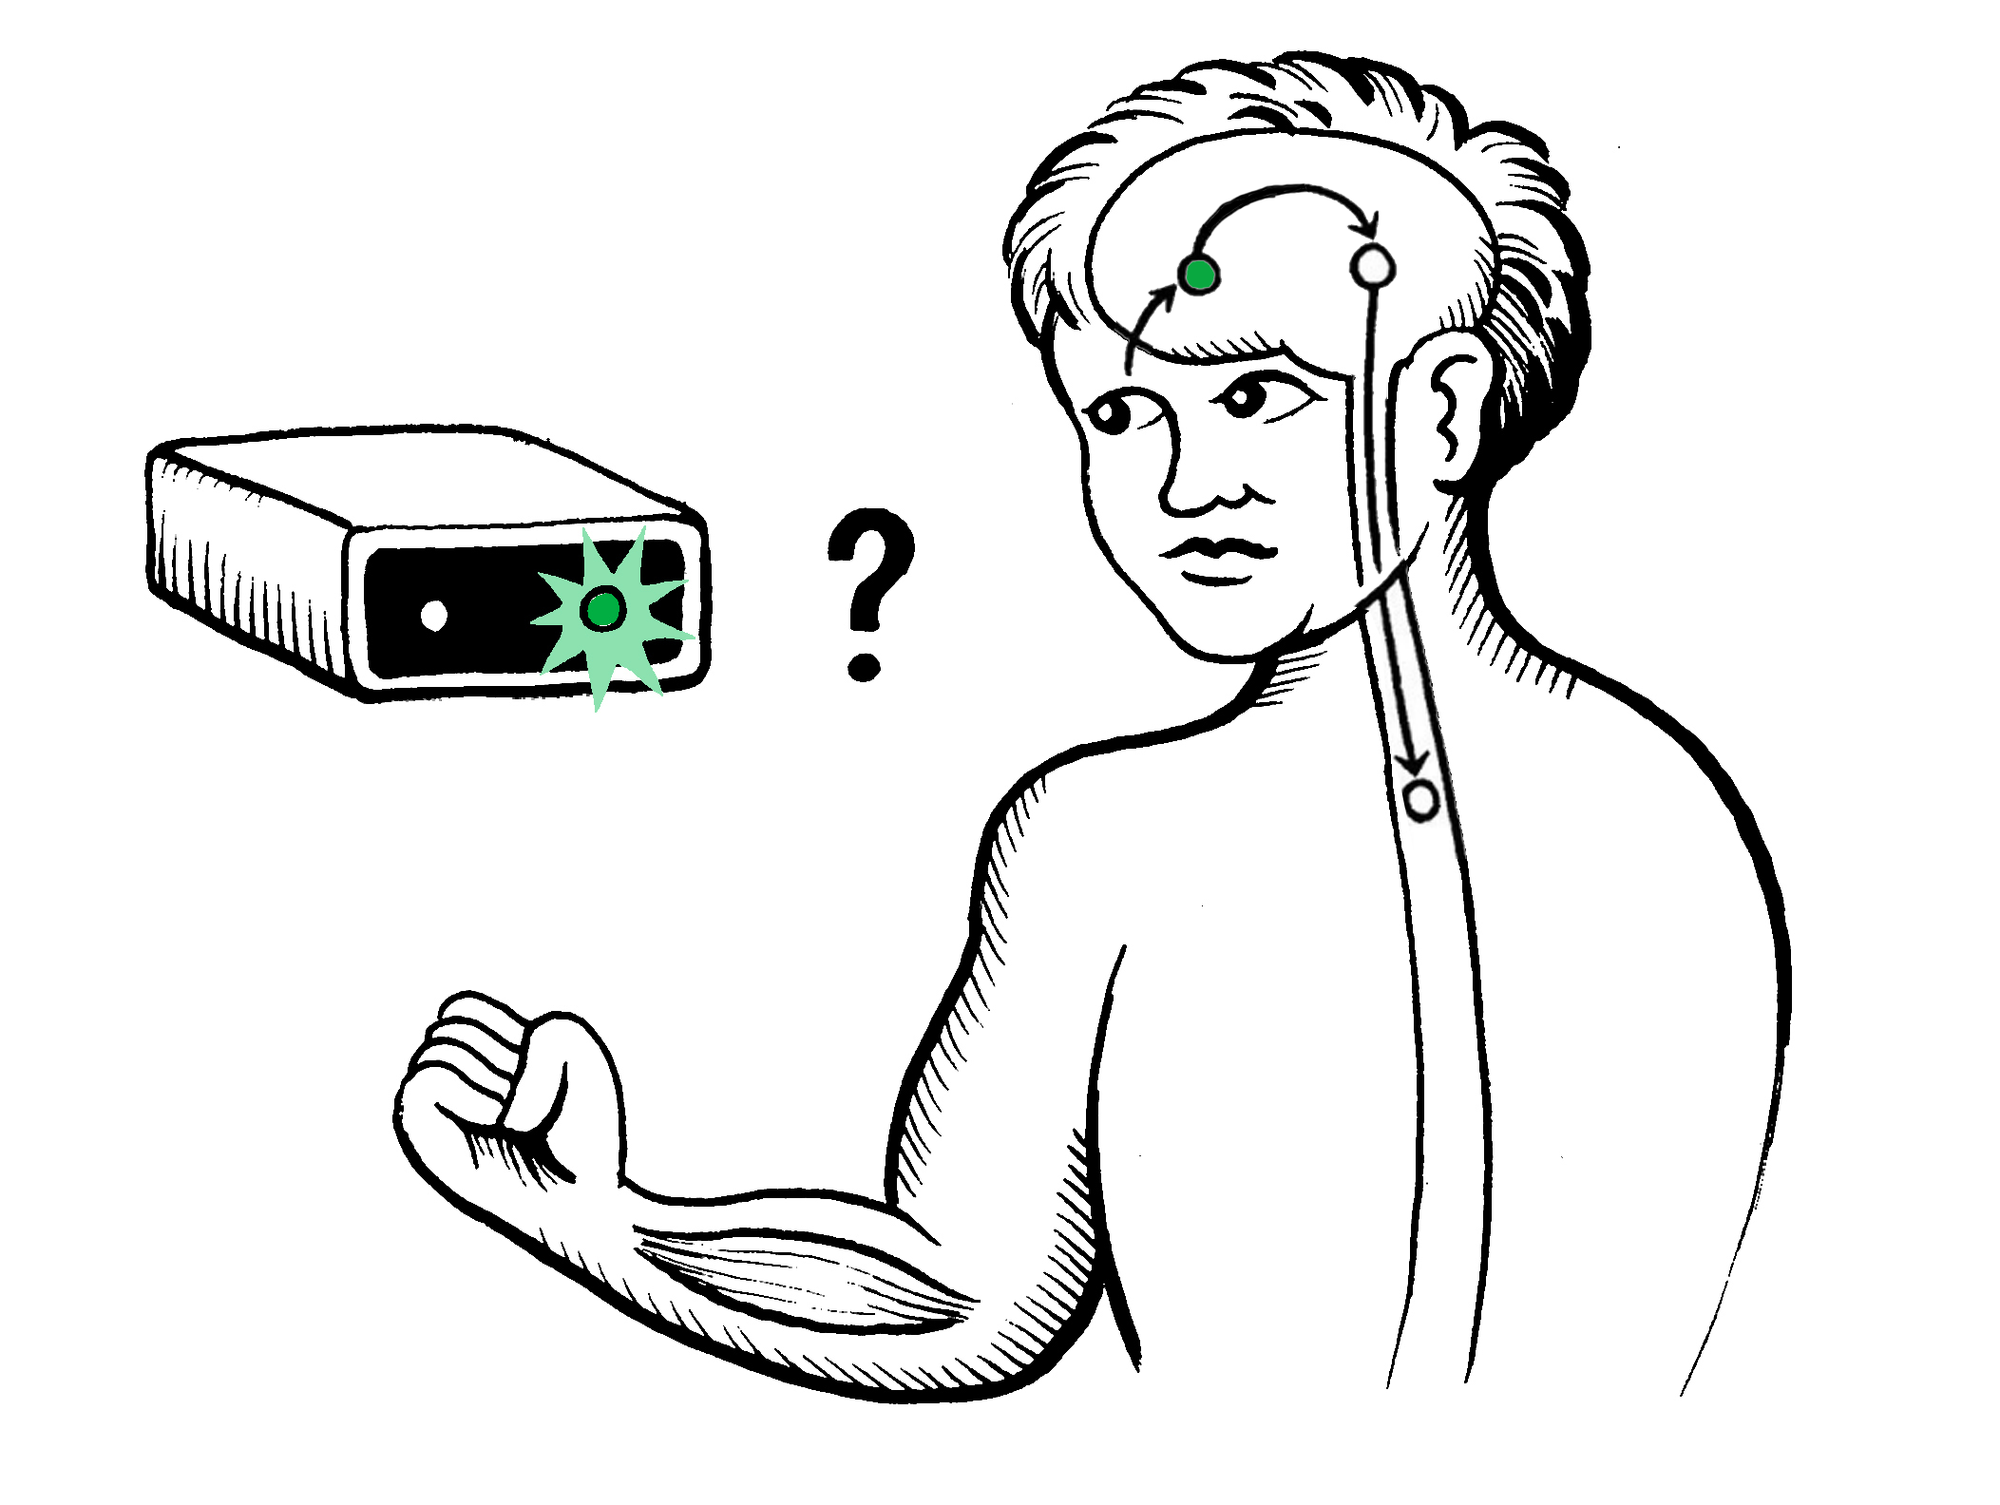
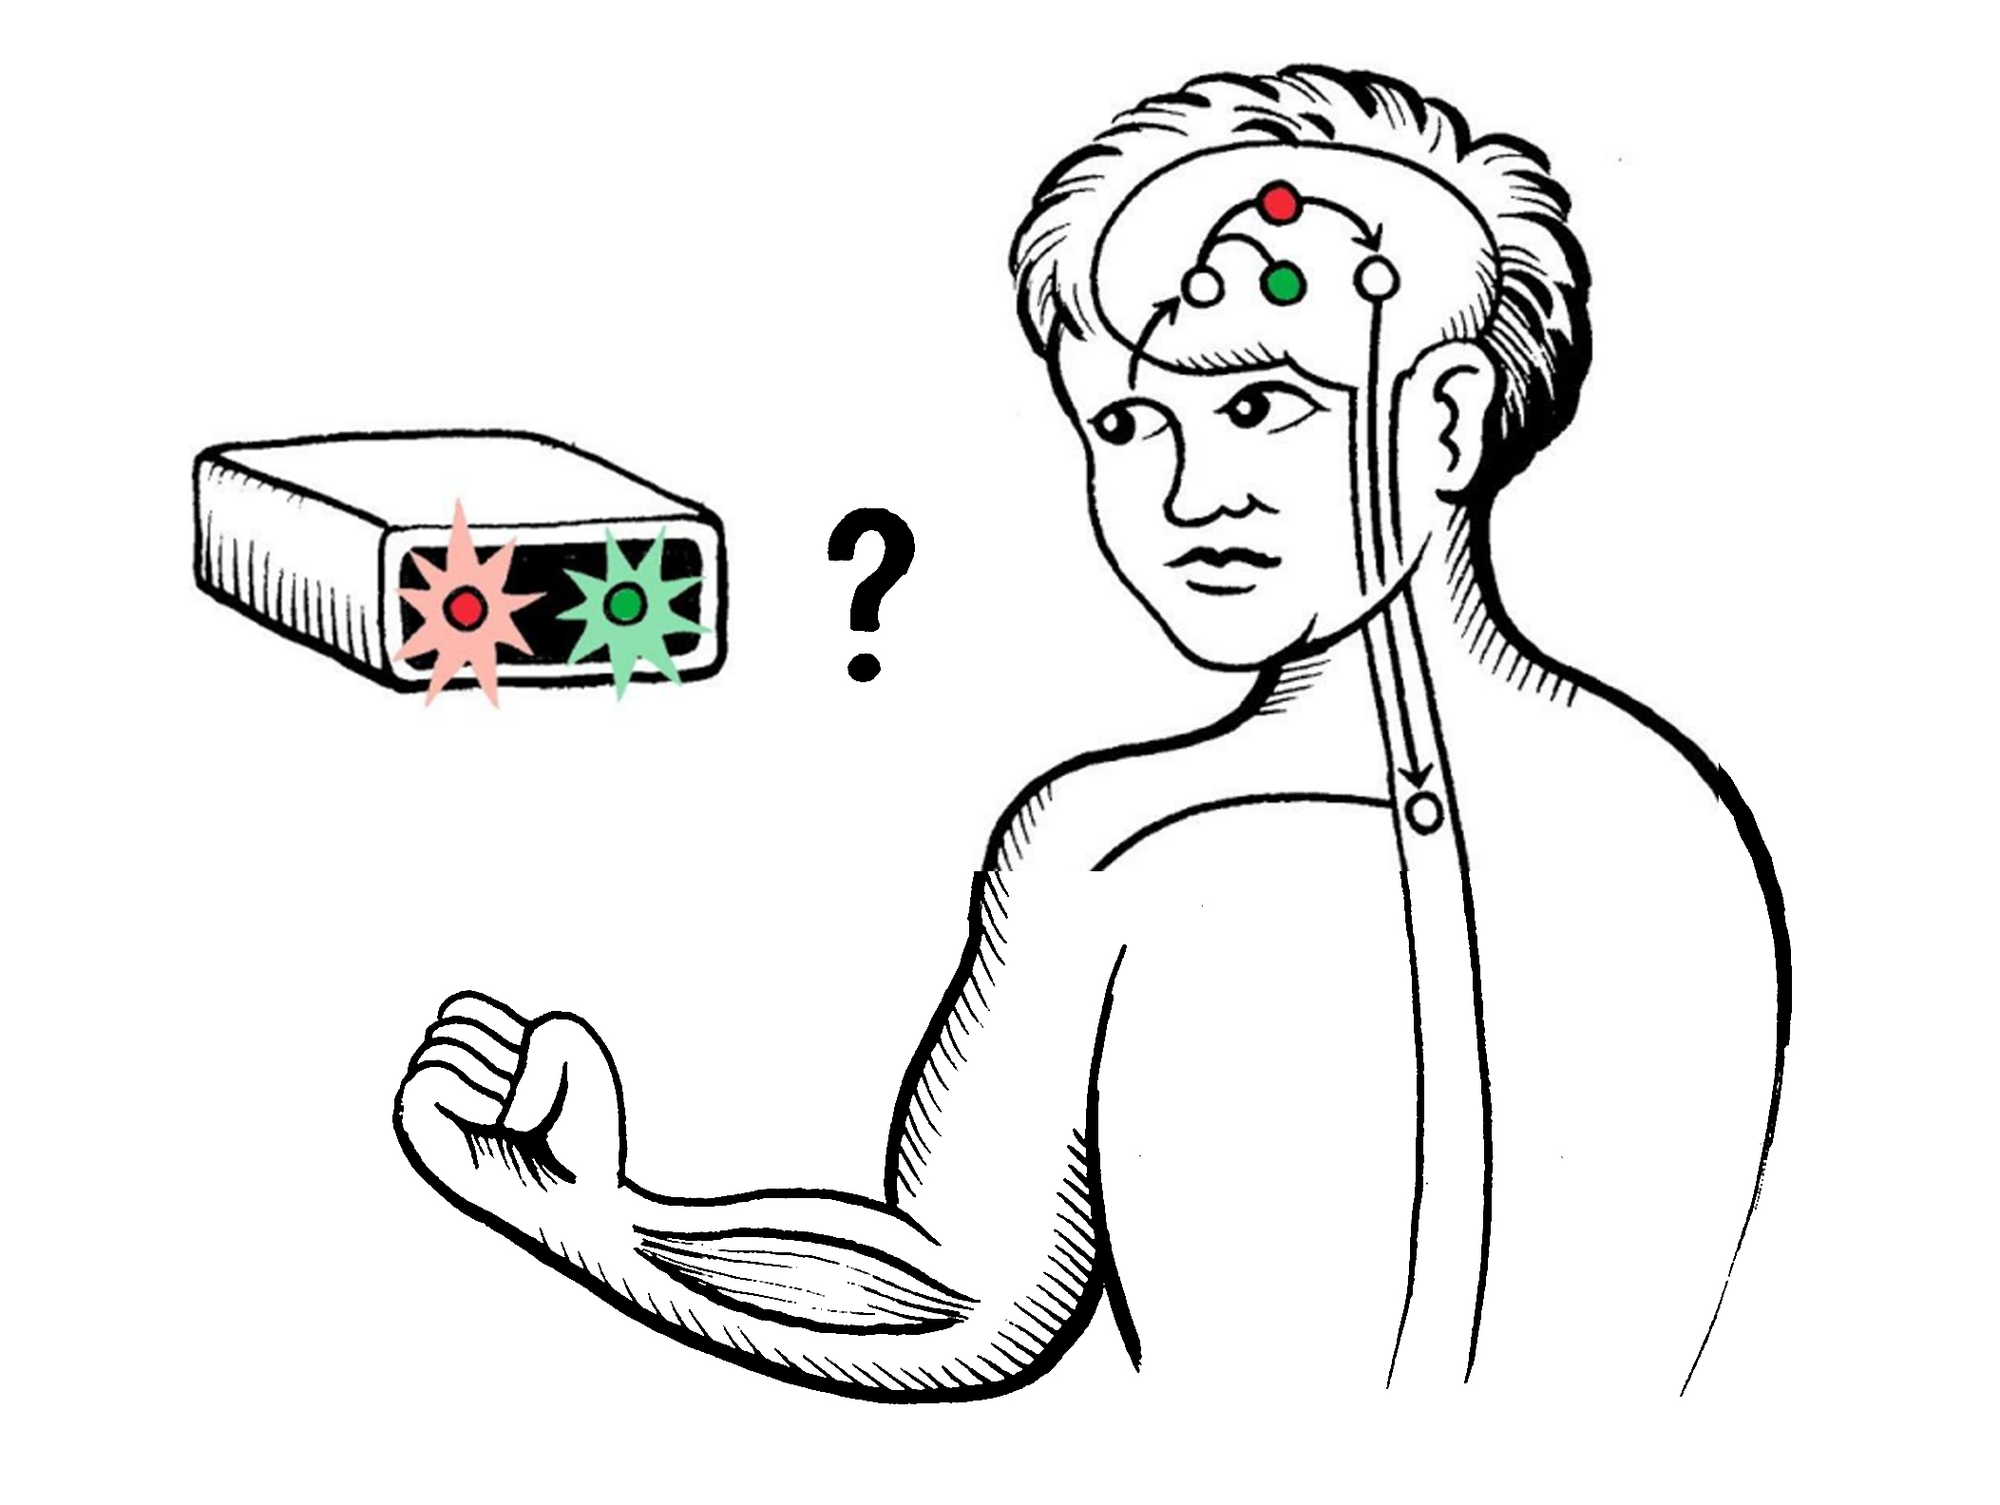
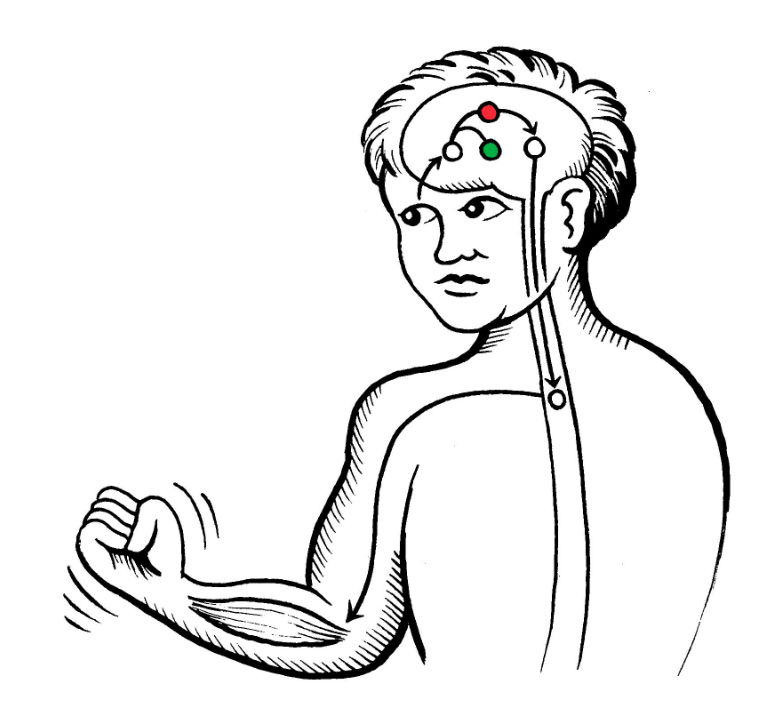
Reflexes are involuntary, protective, and lightning‑fast negative‑feedback loops—such as the patellar knee‑jerk. Reactions are conscious decisions that route through the brain, like a goalie deciding how to stop a blistering soccer ball.
The average reaction time for humans is 0.25 seconds to a visual stimulus, 0.17 for an audio stimulus, and 0.15 seconds for a touch stimulus. Digging deeper, the average conduction velocity speed is approximately 20-80 m/s. It takes approximately 1 ms for a neurotransmitter to cross the synapses.
But don't just take our word for it - try it out for yourself!

NEUROSCIENCTIST APPROVED CLASSROOM EXPERIMENTS
Get hands‑on with reflex arcs and reactions; learn how to measure response speed like a scientist
WANT TO DO MORE NEUROSCIENCE?
LEARN ABOUT SPIKERBOX! (EDUCATIONAL BIOAMP KIT)
WANT TO DO MORE NEUROSCIENCE?
LEARN ABOUT SPIKERBOX! (EDUCATIONAL BIOAMP KIT)
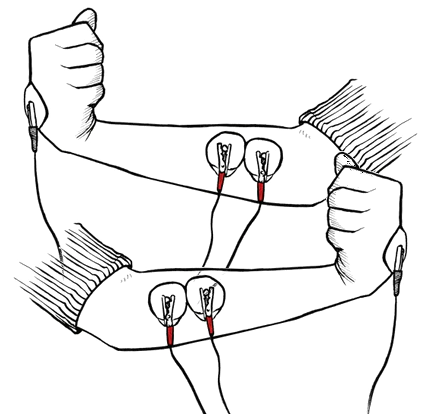
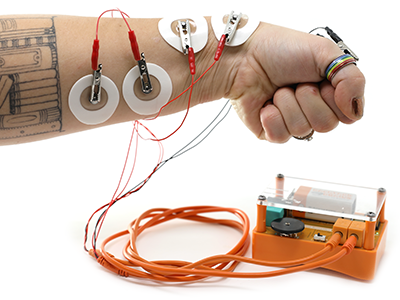
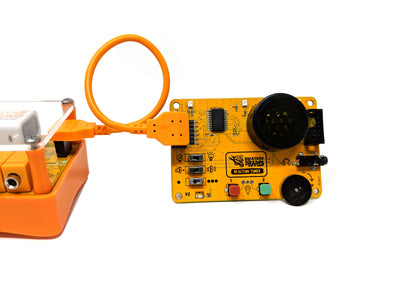
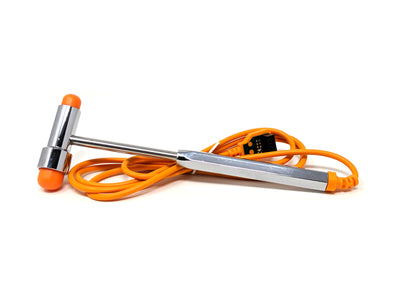
Note: Backyard Brains offers a digital Reaction Timer as well as a Reflex Hammer add-on for our spikerbox. Both can correlate input ( whether that be the moment you press a button or the time a hammer falls to your EMG, thus giving you a more precise reaction time! ).
While you're waiting for your order to ship, here's an experiment you can try!
Starter Experiment

What Will You Learn?
- How do reaction and reflexes differ
- How do I measure my own reaction time
- How do I compare to the average human reaction time

Background
This reflex is called a stretch reflex and is initiated by tapping the tendon below the patella, or kneecap. It was first independently described in 1875 by two German neurologists, Wilhelm Heinrich Erb and Carl Friedrich Otto Westphal. In their original papers Erb referred to the reflex as the "Patellarsehnenreflex" while Westphal denoted it as the "Unterschenkelphanomen". Thankfully, we now refer to it as the patellar reflex.
History
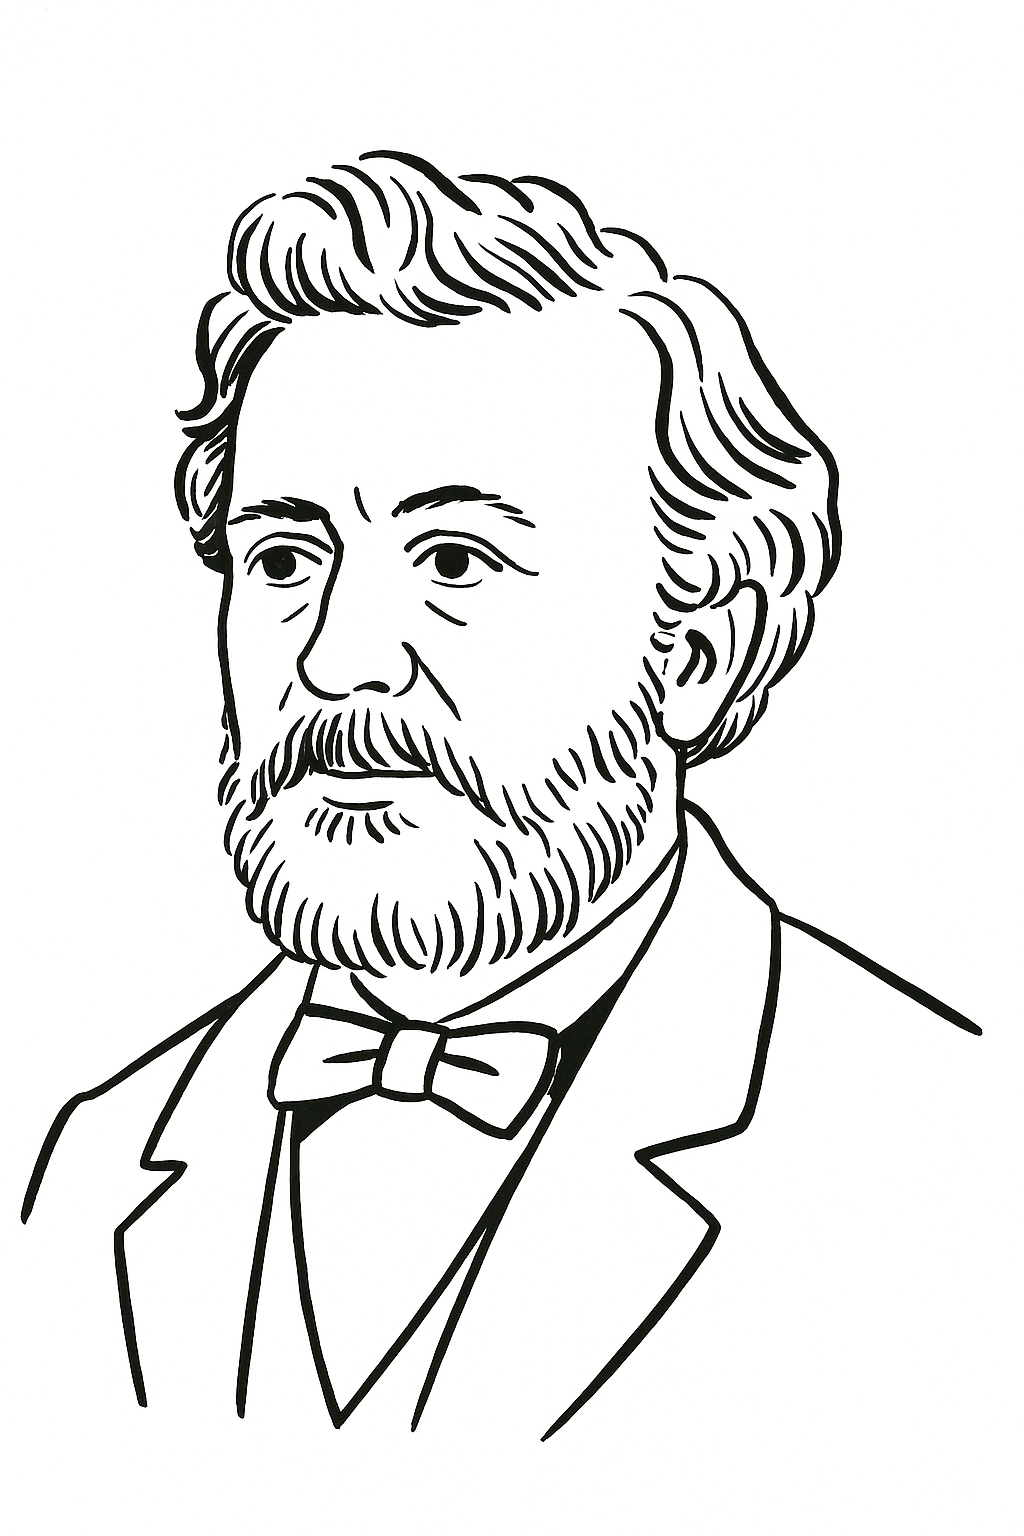
How Reaction Time Started
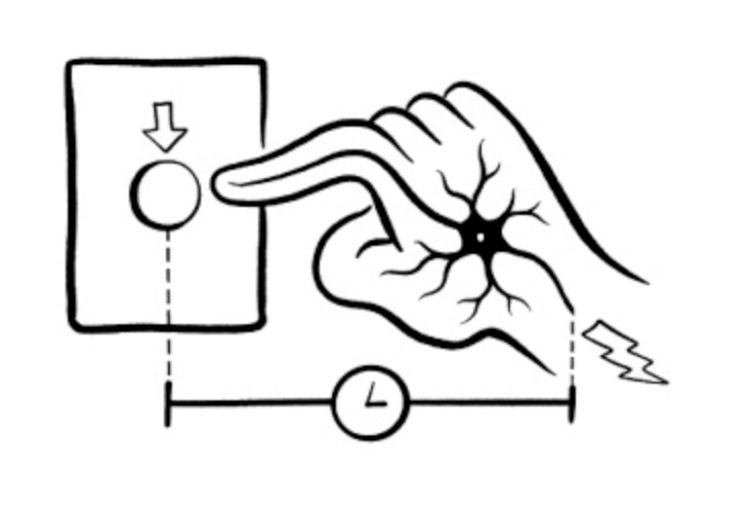
Like all science, the history of the reaction time discovery is peculiar. Dutch physiologist F.C. Donders (seen here) in 1865 began to think about human reaction time and if it was measurable. Prior to his studies scientists thought that human mental processes were too fast to be measured. This assumption was proved incorrect with the help of Charles Wheatstone, an English scientist and inventor. In 1840 Wheatstone invented a device, much like his early telegraph system invention, that recorded the velocity of artillery shells. Donders used that device to measure the time it took from when a shock occurred on a patient's foot until when that patient pressed a button. The button had to be pressed by the left or right hand matching the left or right foot that was shocked. His study tested 2 conditions: in the first, the patient knew in advance which foot was to be shocked; in the other condition, the patient did not know. Donders discovered a 1/15 second delay between patients who knew which foot was to be shocked versus patients that did not know. Notably, this was the first account of the human mind being measured!
These efforts continue today, with the improvement of "non-invasive" imaging technologies like fMRI, PET, EEG, etc... You may have had one of these scans in the hospital. These tests all measure the "speed of neural transmission", which we cover in-more detail with our other experiments.
Procedure
Experiment 1
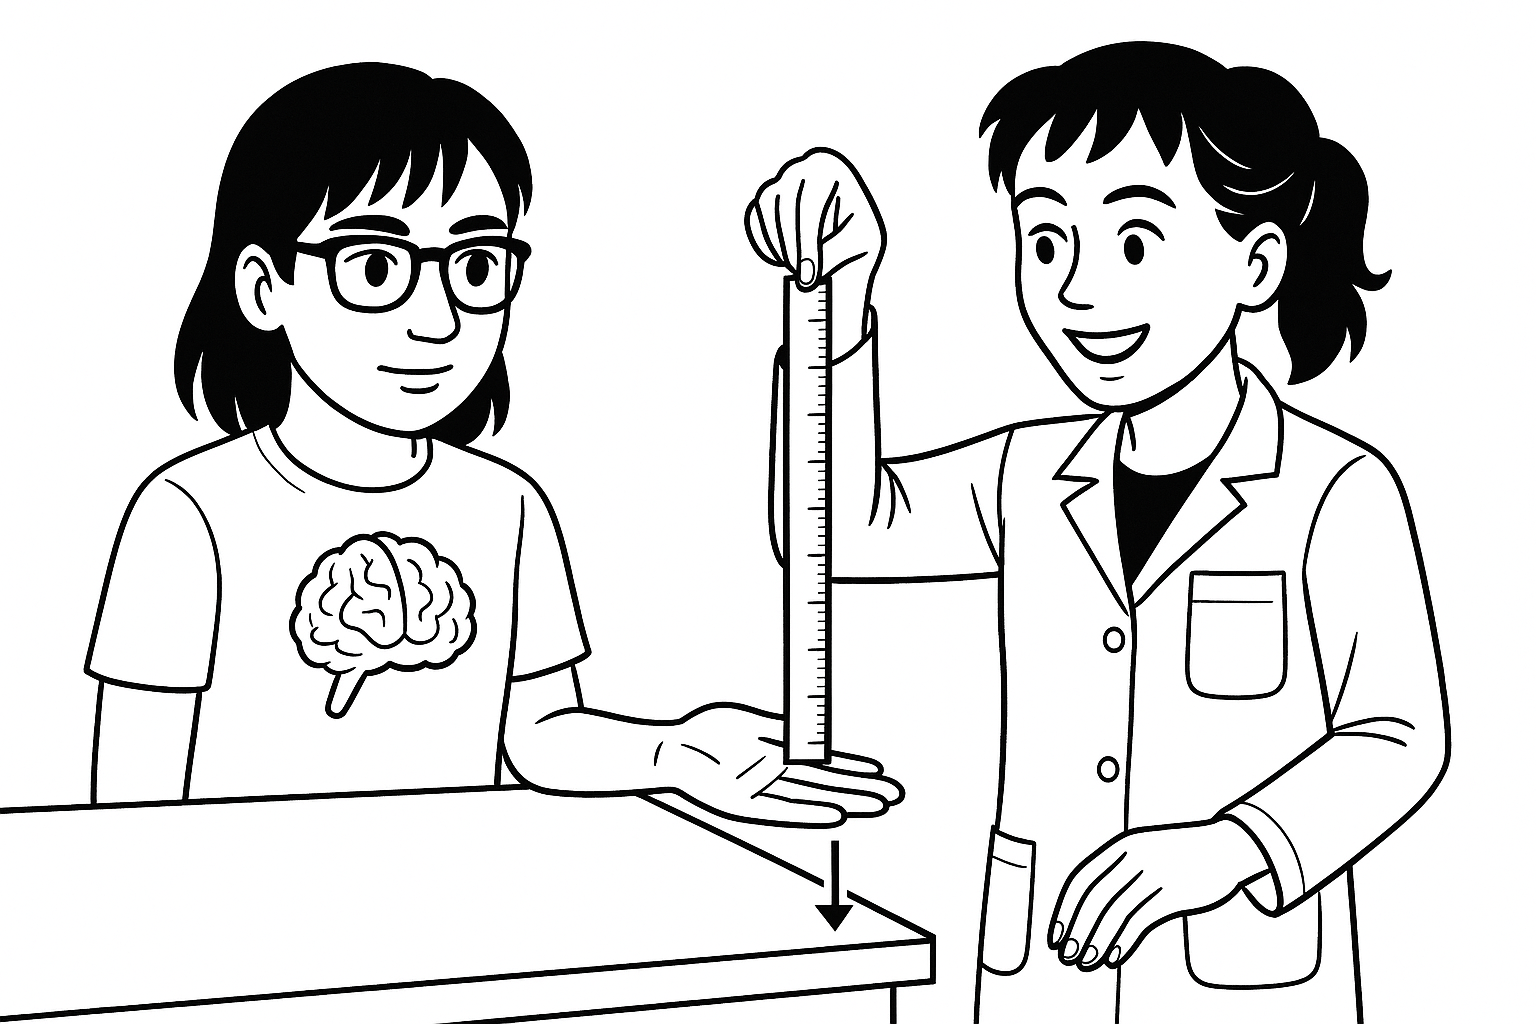
In this phase, you and your partner will test visual reaction time.
- Have your friend sit at a table with their dominant hand over the edge.
- First we will test visual response. Hold the ruler at the 30 cm mark so that the 0 cm end is just at your friend's index finger.
- Tell your friend that when you release the ruler they are to grab it as fast as possible. Do not make any sounds or gestures that you are releasing the ruler. They have to react to the visual stimulus of seeing the ruler being released.
- Record the centimeter mark.
- Repeat the experiment three more times. Then switch places with your partner and redo it.
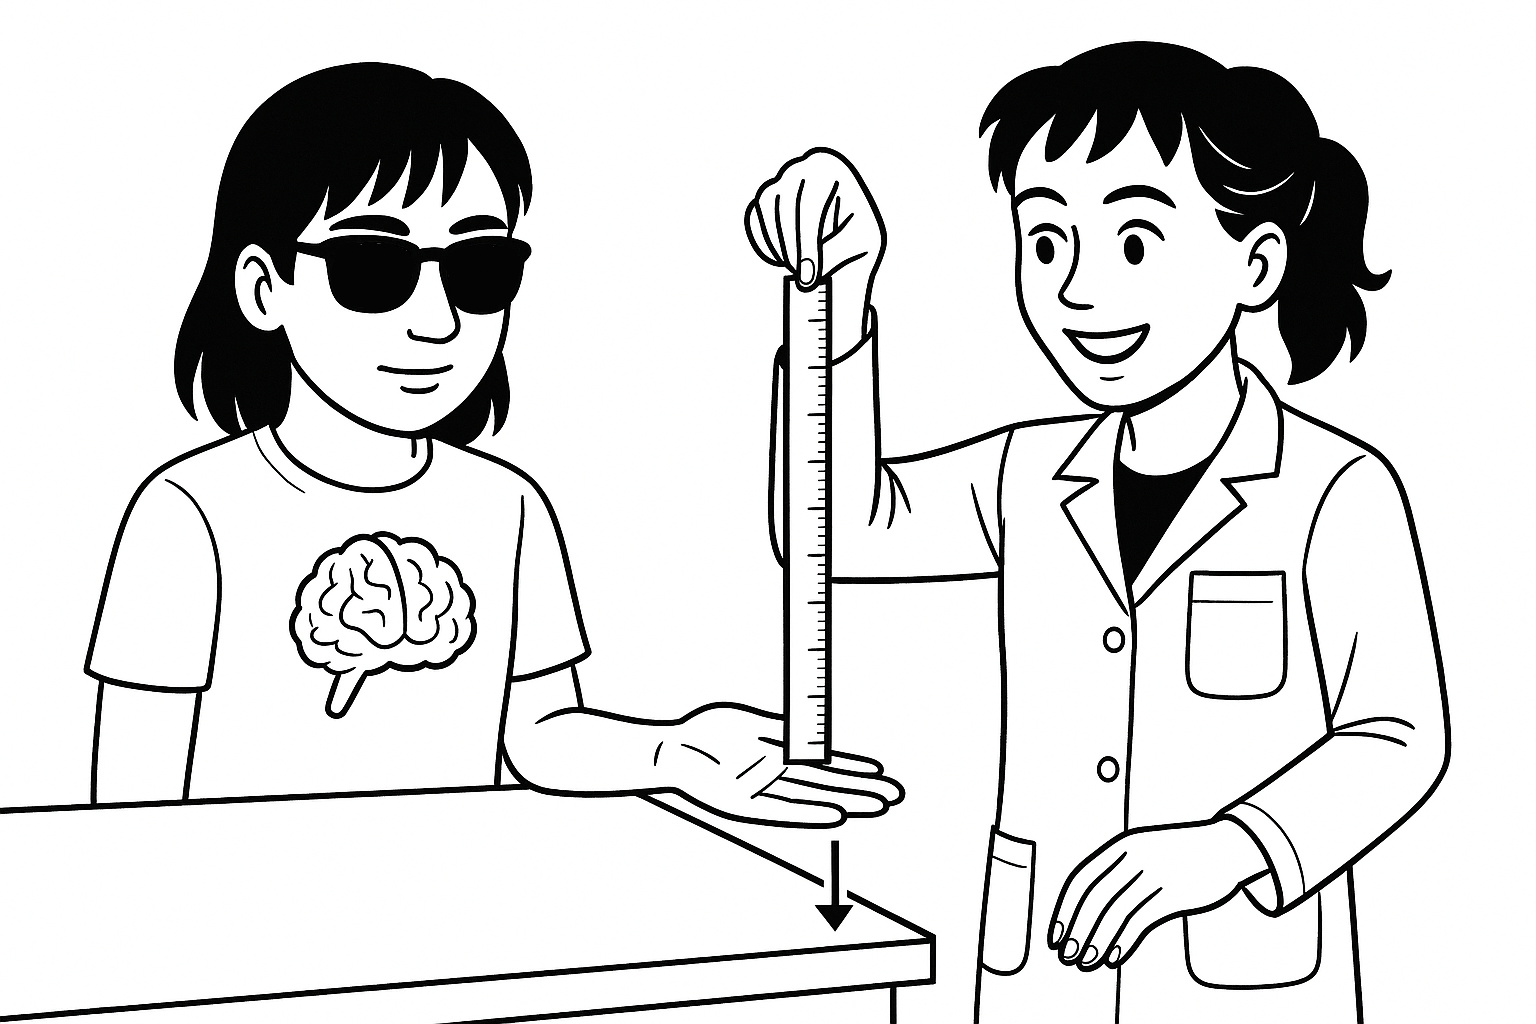
Experiment 2
In this phase, you and your partner will test auditory reaction time
- Have your partner sit as the table, like before,
- Tell your partner that you will release the ruler and they must grab it as fast as possible.
- When you are ready to begin, randomly decide when to drop the ruler. Say "dropped!" as you do so.
- Record the centimeter mark and repeat 3 more times, remember to randomly decide which ruler to drop. Switch roles and repeat 3 more times, but never tell your partner when you will drop.
- Again as before switch roles and redo.

Results & Analysis
To make sense of our data, we need the kinematic equation for uniformly accelerated motion (specifically, from rest). y = y = ½ * g0 * t²
The formula below is comprised of three variables.
Y = the distance you measured in centimeters
g0 = the acceleration due to gravity constant (981 cm/sec² )
t = time in seconds
Our equation is: y = ½ * g0 * t². Or, in terms of t, t = √ (2y/ g0)
Here is an example of the equation being used:
Suppose we record a measurement of 10 cm.
t = √(2 * 10 cm / 981 cm/sec² )
t = √(20 / 981 sec² )
t = 0.1427 sec ≈ 0.14 seconds
Using the math above, we will take the centimeter measurements you have collected and convert the measurement in centimeters to seconds. This will tell you how long it takes, in seconds, an object (the ruler) to fall a certain distance.